Healthcheck Dashboard
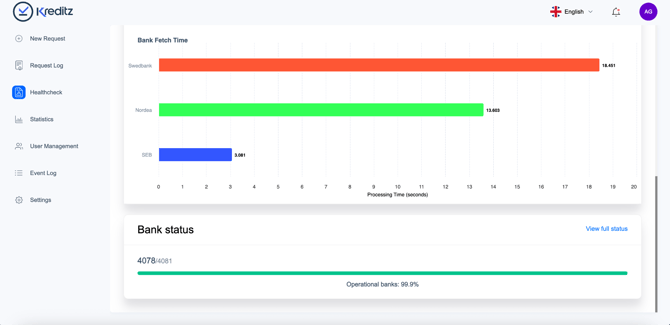
When you click Healthcheck in the left-hand navigation menu, you’ll arrive at the Healthcheck dashboard. Here’s what you can see:
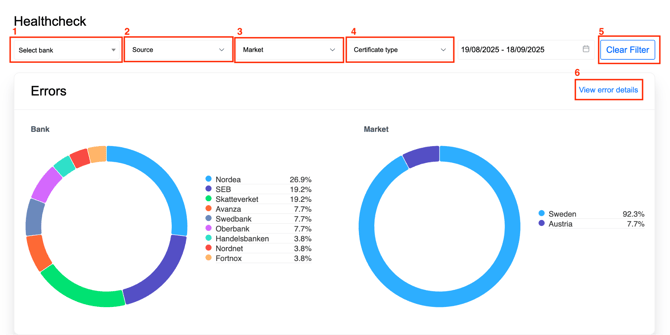
- Failed requests: Get an overview of how many requests you’ve sent that didn’t go through. The graphs show failed connections per bank and market, based on the selected date range.
- By default, the dashboard shows data from today going back 30 days, but you can adjust the range to fit your needs.
- Bank fetch time: See how long it takes for banks to deliver data to Kreditz after a successful connection. This helps you understand processing times.
- Bank status: Check the operational status of banks in real time to see if there are any disruptions that might affect your requests.
This dashboard gives you a quick, visual snapshot of performance, so you can spot issues, track trends, and keep everything running smoothly.
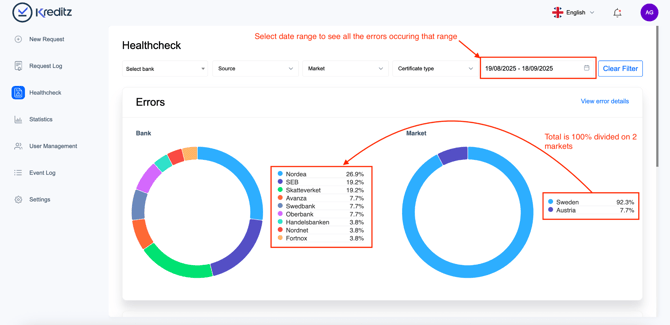
Select a Date range and View Errors
You can customize the date range to see all errors that occurred during a specific period.
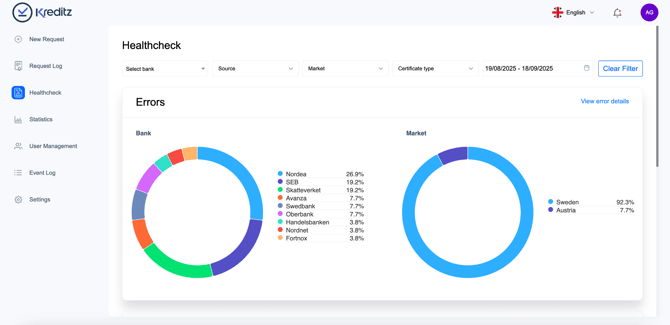
- Bank graph: Shows all banks where connections failed.
- Market graph: Shows the markets affected by failed bank connections.
💡 Tip: Hover over any bar in the graphs to see more details, or click on a bank or market to get additional information about the failures. This makes it easy to pinpoint exactly where issues are happening and take action quickly.
Filter and Explore Errors
In the Healthcheck dashboard, you can filter errors to focus on what matters most.
You can filter by:
- Bank – choose a specific bank.
- Source – see which channel the request was sent through (Email, SMS, API, etc.).
- Market – narrow down by market.
- Certificate type – select between Consumer or Business.
Other helpful actions:
- Clear filters (5): Reset all filters with one click.
- View error details (6): Get more information about the errors for the selected requests.
💡 Tip: Filters help you quickly find patterns – for example, if errors only occur in a certain market or through a specific delivery channel.
View Error Summary
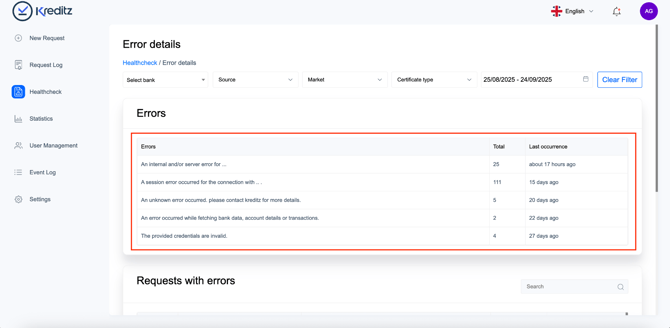
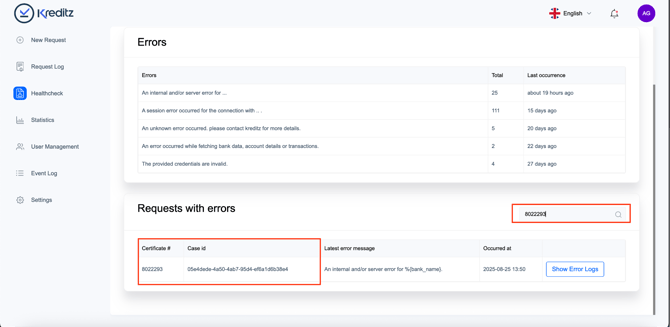
The Errors box shows the total number of errors for requests based on your selected date range (by default, the last 30 days).
For each error, you can see:
- Error type – What kind of error occurred.
- Count – How many times this error happened.
- Last occurrence – When this error was last recorded.
💡 Tip: Reviewing the error summary helps you quickly understand which issues are most frequent and when they happened, so you can take action efficiently.
Understanding Error Messages
Most error messages come from two main sources:
- Bank-related issues – For example, when a bank is experiencing technical problems.
- End-user issues – Such as:
- Not enabling account sharing through PSD2
- Entering the wrong credentials
- Trying to connect accounts that are shared but don’t have the right permissions
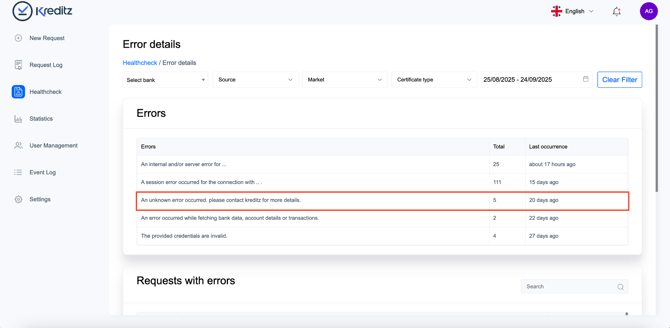
👉 Important: If you see this message:
“An unknown error occurred. Please contact Kreditz for more details.”
That means the issue couldn’t be identified. In this case, please contact Kreditz Support (support@kreditz.com) for assistance.
💡 Tip: Always check whether the error is linked to the bank’s status or end-user actions before reaching out to support.
Viewing the Request Error List
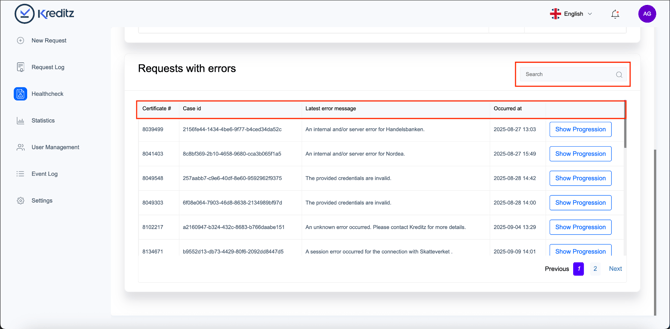
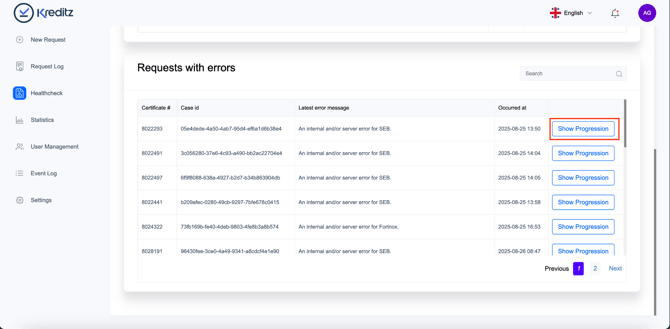
In the error list, you can see all requests where an error has occurred. The list displays:
- Certificate ID (#)
- Case ID
- Latest error message
- Occurred at (the date and time of the error)
You can also use the search field to quickly find a request. Simply enter either the Certificate ID or Case ID to locate it.
💡 Tip: Searching by ID is the fastest way to track down a specific error if you’re handling multiple requests.
Searching for a Request
As mentioned earlier, you can quickly find a specific request by using the search field.
- Enter either the Certificate # or the Case ID.
- The list will filter automatically, showing you only the matching request(s).
💡 Tip: Use search when you already know the ID of a request — it’s the fastest way to jump straight to the details.
Viewing Request Progression
You can also see a more detailed view of a request with errors — this shows the journey of the end user step by step.
- Click “Show Progression” to open the detailed view.
- If you’ve searched for a specific request, the button will appear as “Show error logs.”
This view helps you understand exactly where in the process the error occurred.
💡 Tip: Use this feature to trace the end user’s path – it’s especially helpful for troubleshooting recurring issues.
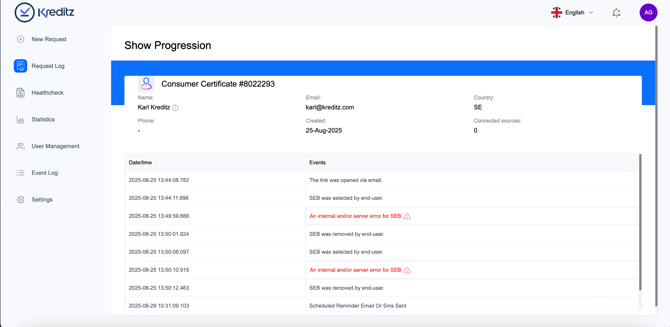
End-user Journey View
As mentioned before, this view lets you follow the journey of the end user for a request that has errors.
By seeing each step in the process, you can identify exactly where things went wrong and better understand how the error occurred.
💡 Tip: Use this view to get full context before reaching out to support or the end user — it saves time and makes troubleshooting easier.
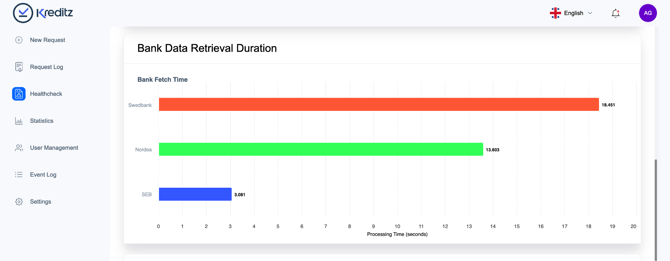
Bank Data Retrieval Duration
This section shows how long it takes for banks to deliver data to Kreditz after the end user has given consent and authenticated.
By tracking fetch times, you can:
- See how quickly different banks provide data
- Spot delays that might affect your requests
- Compare performance across markets
💡 Tip: Longer fetch times may be temporary and linked to a bank’s system load. If delays are consistent, it’s worth monitoring more closely, and reporting them to Kreditz Support (support@kreditz.com).
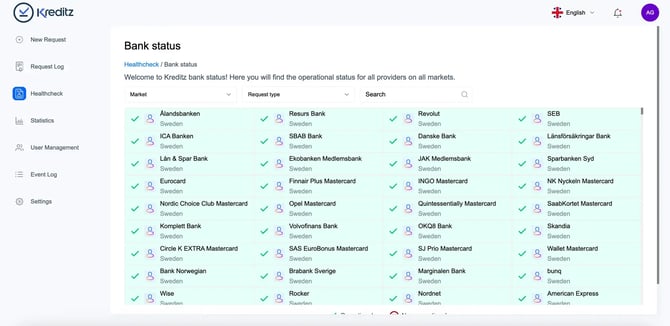
Bank Status
The Bank Status section shows the operational status of all available banks.
- Quickly see if a bank is up and running or if it’s experiencing issues.
- Click “View Full Status” to see more detailed information for each bank.
💡 Tip: If a bank is experiencing issues, it may affect requests sent to that bank. Check here first before troubleshooting further.